I tried several ways of tracking and charting my cycle but none of them quite worked. So I created my own way which I call the Graphical method. Because it’s done on graph paper. Simple!
I found journalling quite cathartic but it took too long and was really difficult to identify trends and patterns. I had to re-read everything which took so long that I never did it and so I missed out on one of the key benefits of tracking which is to know your cycle so that you can play to your differing strengths and nurture your weakspots. This reduces stress and tiredness and gives you more balance in all areas of your life.
Then I tried a couple of downloadable charts but there was too little space to note down all the things I wanted to. These often have space only for a 28 day cycle but mine was usually longer than that so it got a bit messy. And again it was too difficult to identify trends and patterns.
Being an Environmental Scientist by education, I then tried spreadsheets! It meant I had to be at my computer to do it, rather than just being able to scribble something down whenever it occurred to me. Doing it on a laptop also seemed to take the heart out of it – I much preferred to write – it feels more personal and connected. I also got carried away and recorded so much that it became an enormous spreadsheet and still too difficult to spot trends and patterns.
How about phone apps? I’m not a fan of my phone as you can’t see all the information you want to see at a glance. They didn’t have all the fields for what I wanted to record. And yet again it was too hard to spot trends and patterns.
And thus my Graphical method was born! Ta da!
This is how to do it.
1. Get some graph paper
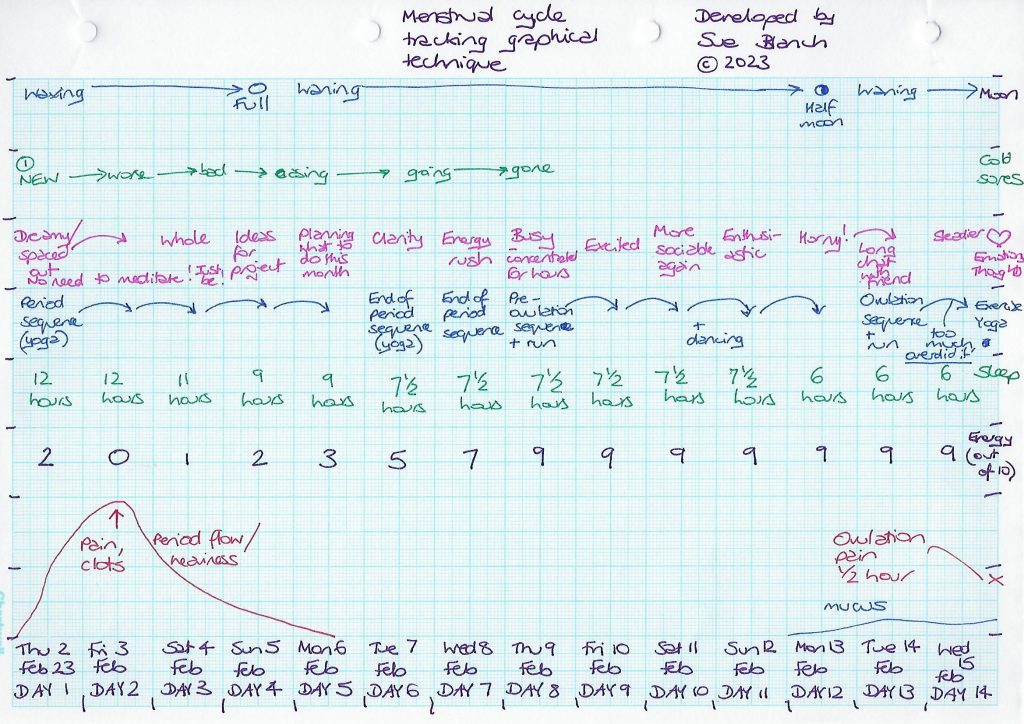
Along the bottom long side (the x axis) you write the date and the day of your cycle, starting at Day 1.
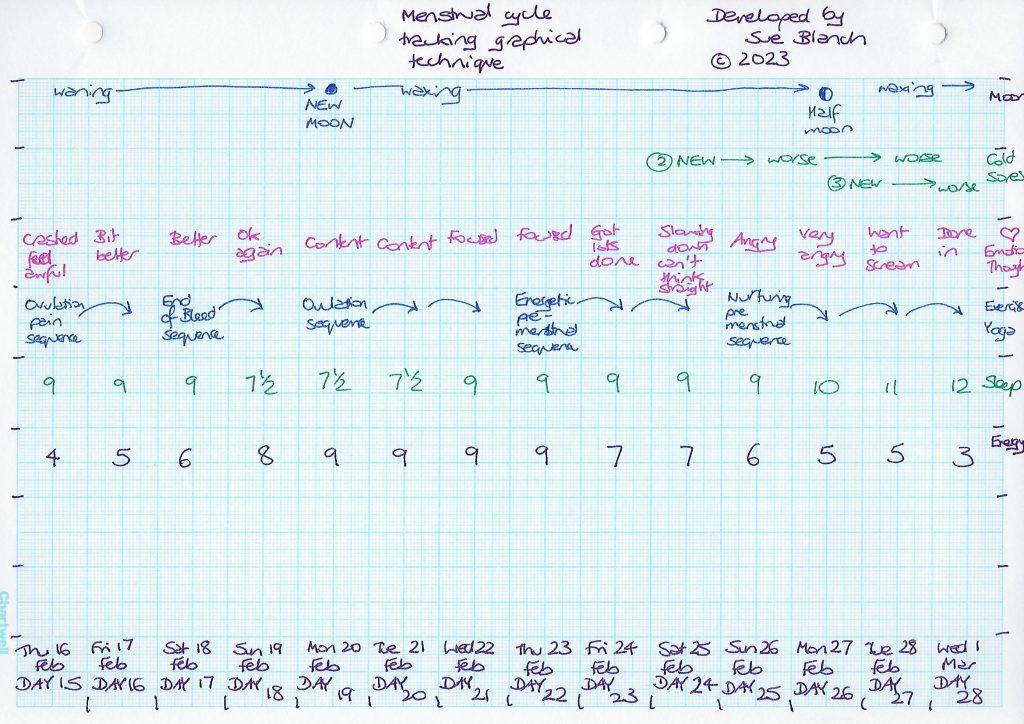
You can fit 14 days on one sheet of A4 graph paper. So put Days 1 – 14 on one sheet and Days 14 – however long your cycle is, one another sheet or sheets if your cycle is longer than 28 days.
2. Prepare your chart
Along the short side (the y axis) you write the things you want to track. Always track the key things:
- When your period is, how long it lasts, how heavy it is/ the flow and any pain or clotting.
- When you get mucus/ discharge, when you ovulate (if you can tell – it might take a while for you to become aware of it) and any ovulation pain.
- How much energy you have – you can give it a score out of 10 or rate it high, medium, low or none.
- How much sleep you have (or needed but didn’t get!).
- Your main thoughts and emotions.
- What exercise/ movement/ yoga you did – and how it made you feel at the time and afterwards.
It’s best to start with these things for a few cycles. That’s plenty to be focussing on to begin with.
3. Expand your chart
When you have a good picture of the key changes of your cycle you can start to refine it to learn even more.
Add whatever is important to you and you want to focus on.
Pick one or two things that are troublesome for you, or you want to have more on in your life.
The options here are limitless but only track what you can fit on an A4 sheet of graph paper, otherwise it becomes too time consuming and a burden to do, plus too much information to reflect back on.
Stick to tracking the same things for several cycles so that you can reflect on it and identify trends to work out how you can better take care of yourself, and when is the best time in your cycle to do the things you want and need to do.
For example, you might choose:
- Creativity – when you get new ideas, when you are able to create whatever it is that you create and when it feels like bloody hard work.
- Confidence – when you feel you can take on the world and when you want to crawl back under your duvet and everything inbetween.
- Stress – when you are stressed and the slightest thing makes you want to scream or cry and when nothing bothers you and you can get anything done no problem. You can give it a score out of 10 or rate it high, medium or low.
- A recurring health condition you have – maybe it only occurs at certain points in your cycle and you can learn to manage it better by more self-care around that time.
- Phases of the moon – only if you feel an affinity with the moon or are affected by it. For me this has a big influence on how I feel. For instance, if my period was at new moon I felt nicely cocooned and nurtured. If it my period was at full moon, I felt like I was being grilled alive!
4. Every day
At the end of every day or the beginning of the next day, note down how you were that day.
You just need one or two words. Or if you’re artistic you can draw a little picture.
Use colour.
Make it your own.
Use it to express how you feel.
If you miss a day or a few days – that’s okay. Come back to it when you’re ready and just add a note that you “missed a few days because….”. This in itself will tell you a lot about your cycle. Maybe you were in the Ovulation phase and too busy going out and having fun to be bothered with charting. Or may you felt so rough during your period that you just couldn’t do it.
5. Review at the end of your cycle
Review what you’ve tracked on your graph paper.
This is best done as you start to come out of your period. At the very end of your cycle when your period starts you will not have the mental capacity to analyse. Your brain will be too floaty. Towards the end of your period you will naturally start to think about what you need and want to do in the next cycle. Reviewing what you’ve noted down will help you get ready for your next cycle so you can live in sync with it and have more of the things you want in life and less of the things you don’t.
To do the review, put both sheets of paper side by side and simply look at each thing that you recorded.
For example, if you got period pain, what day was that? Learn that you need to do less the day before the pain comes on your next cycle and see if that alleviates the pain.
Look at the amount of sleep you got or didn’t get and if it was not enough or too much, adjust how much sleep you get in the next cycle so that you give yourself more sleep on the days you need it and less on the days you don’t.
Work out which days you were more stressed or sensitive and cut yourself some slack on those days in your next cycle.
And so on.
You get the picture.
6. Compare after 2 or 3 cycles
Compare each cycle with the others.
This is the joy of this Graphical method. You can see all the cycles at a glance.
I sit on the floor and spread them all out in front of me.
You can pick the days that are key for you and see what you’ve noted down for that day on each of the cycles.
Or you can pick a thing that you’ve tracked and see if it ebbs and flows in the same way in each cycle.
This is where the real treasure of charting lies.
By doing this I discovered that I always got pain on Day 3 at about 10.30am! So I learnt to rest up on Days 1, 2 and 3. And hey presto! No pain.
I also found out that my energy levels crashed on Day 23 so I’d be busy on Days 20, 21 and 22 and then from Day 23 I’d slowly start to ease off on everything. Bingo! My PMS wasn’t so bad.
And finally, remember to use this as a tool. It’s a means to an end, not an end in itself. Charting will help you discover the physical, mental and emotional changes you go through during your cycle. It will help you realise that these are normal for you. There’s nothing wrong. You don’t need fixing. Chart in a way that serves you, that will tell you what you want to know. Use it to take better care of yourself so you can play to your strengths in every area of your life and better manage the things that are difficult for you.
Discover more about menstrual cycle tracking and living in sync with the natural changes of your cycle in my book Yoga and the Menstrual Cycle – Live in Harmony with Your Natural Rhythm available here
Recent Comments